Measure Tool
Overview
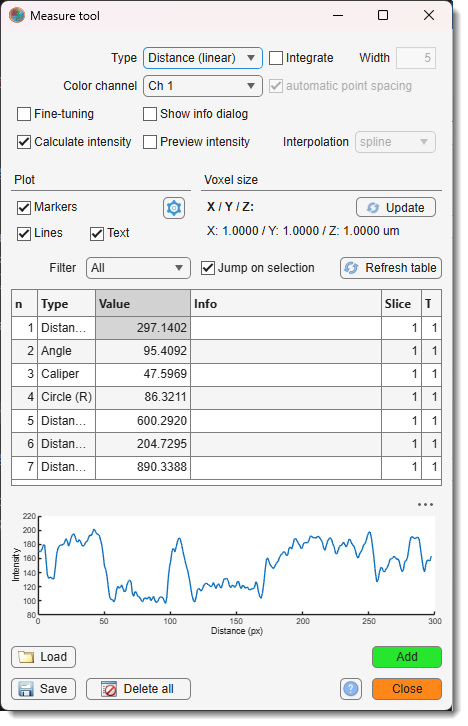
Based on the Image Measurement Utility by Jan Neggers, Eindhoven University of Technology. This tool enables various length measurements and generates corresponding intensity profiles.
Note
Visualization of measurements can be switched on/off using the checkbox in the View Settings panel.
Measure panel
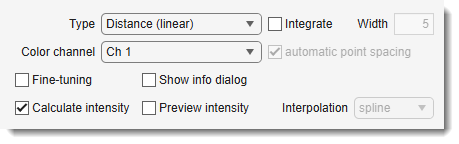
Defines the measurement type, started with the button.
- : measurement type — Angle, Caliper, Circle (R), Distance (freehand), Distance (linear), Distance (polyline), Point.
- : color channel used for intensity profiles.
- : allows position adjustment of each vertex during placement before accepting.
- : generates an intensity profile along each measurement.
- : after placing a measurement, prompts for an annotation text label.
- (Distance, linear only): shows a live intensity profile while drawing the line.
- (Distance, linear only): laterally integrates the intensity profile across the line. Set the integration half-width with the edit box.
- (Distance, freehand only): when checked, the freehand path is automatically simplified (every 10th raw point is kept). When unchecked, a dialog prompts for a density reduction factor.
- (Distance, freehand and Distance, polyline only): spline interpolation method used to compute the path arc-length.
Examples of tools for manual measurement
- Angle: measures the angle between two lines.
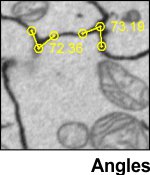
a) place the intersection point;
b) place the second point to form the first line with the intersection;
c) place the third point to form the second line with the intersection;
d) adjust if needed; double-click above the line to accept.
- Caliper: measures the perpendicular distance from a line to a point.
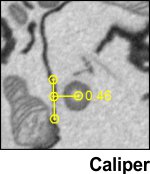
a) place two points to define the line;
b) adjust if needed; double-click above the line to accept;
c) place the point;
d) adjust if needed; double-click above the point to accept.
- Circle (R): measures the radius of a circle.
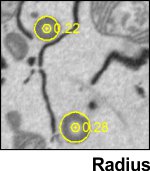
a) place a point at the circle’s center;
b) place a point at the edge;
c) adjust if needed; double-click above the circle to accept.
- Distance (freehand): measures the length of a path.
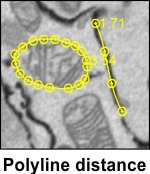
a) select interpolation type with the combo box;
b) press ;
c) draw the freehand path;
d) if is unchecked, enter a density reduction factor to simplify the path;
e) adjust if needed; double-click above the path to accept.
- Distance (linear): measures the distance between two points.
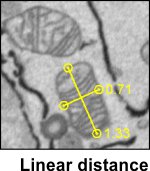
a) place the first point;
b) place the second point;
c) adjust if needed; double-click above the line to accept.
- Distance (polyline): measures a path defined by a series of clicked vertices.
a) select interpolation type with the combo box;
b) press ;
c) click to place vertices;
d) adjust if needed; double-click above the path to accept.
- Point: places a single point.
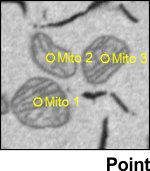
a) place a point;
b) adjust if needed; double-click above the point to accept.
Plot panel
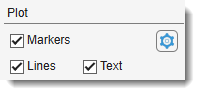
Controls which measurement parts are drawn on the image.
- : show vertex markers (dots) for each measurement.
- : show the measurement lines or paths.
- : show the numeric result and annotation label next to each measurement.
- : opens a dialog to customise line width, marker size, and color for each measurement type.
Voxel sizes panel
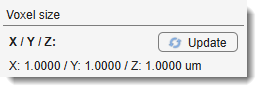
Shows voxel dimensions of the dataset. Update them with the button.
Results panel
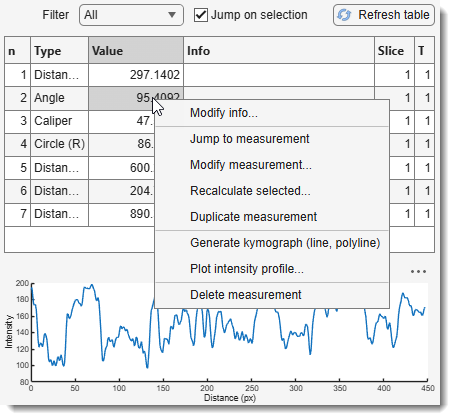
Displays measurement results.
Filter types with
the combo box.
Intensity profiles for selected measurements appear in a plot below the table.
With checked,
the Image View panel centers on the selected measurement.
: refreshes the measurement table.
- Modify info...: edits the annotation text label stored with the measurement.
- Jump to measurement: centers the selected measurement in the Image View panel.
- Modify measurement...: enters edit mode to reposition vertices and adjust the shape.
- Recalculate selected...: recomputes distances and intensity profiles for the selected measurement (useful after pixel size or color channel changes).
- Duplicate measurement: duplicates the selected measurement.
- Generate kymograph (line, polyline): creates a depth projection image beneath the profile for linear, polyline, or freehand measurements. Previewable or savable in TIF, MATLAB, or CSV formats. Tutorial
- Plot intensity profile...: opens the intensity profile in a new figure.
- Delete measurement: removes the measurement from the list.
Buttons at the bottom of the window

- : loads a measurement structure from a file or MATLAB workspace.
- : saves measurements and intensity profiles to a file (MATLAB or Excel) or MATLAB workspace.
- : removes all measurements.
- : opens this help page.
- : adds a new measurement of the type selected in the Measure panel.
Note
you can use M key shortcut to start selected measurement
- : closes the tool.
Reference
Back to MIB | User interface | Ribbon | Tools