The Annotations Tool
BigData mode: supported
Annotations work with BigData datasets (they are stored as coordinates, independent of resolution).
Overview
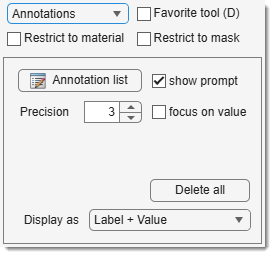
Tools to add/remove annotations, marking specific locations with a label and a value.
: add an annotation at the mouse cursor. - Ctrl +
: remove the closest annotation. - Shift +
: interpolate annotations between the previous and new annotation across dataset depth.
Annotation panel widgets
- open a window listing annotations. Load/save to MATLAB workspace or file (MATLAB/Excel formats), see below.
- specify digits after the decimal point.
- show a dialog for label/value after adding an annotation; otherwise, use the previous annotation’s values.
- prioritize value over label during visualization.
- remove all annotations.
- Display as: choose display mode in the Image View panel:
- Marker: show only a cross-marker.
- Label: show marker and label.
- Value: show marker and value.
- Label + Value: show marker, label, and value.
Presets
Use the following key shortcuts to define and restore presets
- Shift+1, Shift+2, Shift+3 - store preset 1, 2, or 3 correspondingly
- 1, 2, 3 - restore preset 1, 2, or 3 correspondingly
List of annotations
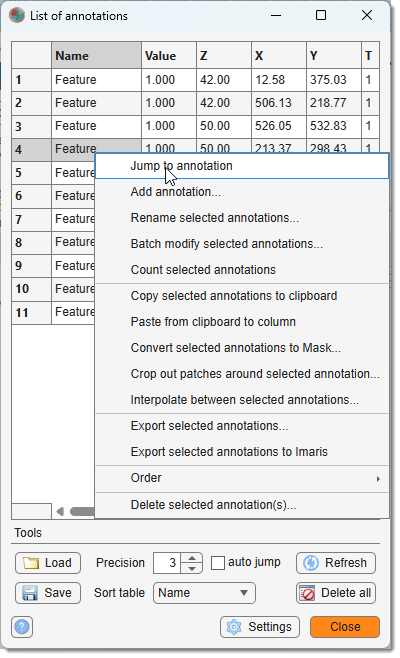
- List of annotations table: shows annotations.
- Jump to annotation: center the selected annotation in the Image View panel.
- Add annotation: manually add an annotation by manually specifying its position, value and name.
- Rename selected annotations: rename selected annotations.
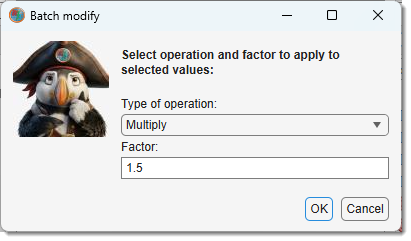
- Batch modify selected annotations: modify values/coordinates with expressions (e.g., set, multiply, add).
- Count selected annotations: count occurrences, displayed in MATLAB and copied to clipboard. Demo
- Copy selected annotations to clipboard: copy as text for Excel.
-
Paste from clipboard to column: paste Excel values to a selected column.
-
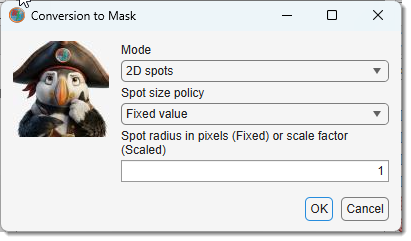 Convert selected annotations to Mask: generate 2D/3D Mask spots from annotations (fixed or scaled size).
- Crop out patches around selected annotations: generate 2D/3D patches with customizable options (e.g., jitter). Demo
Crop patches dialog
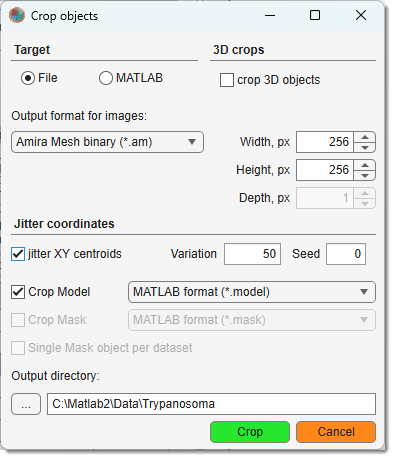
Each patch is centred on an annotation coordinate. The dialog controls how large the patches are, where they go, and what layers are included.
Output destination
- Crop to file — saves each patch as a separate image file in the chosen directory.
Supported formats: TIF (LZW or uncompressed), Amira Mesh binary (
*.am), MRC for IMOD (*.mrc), NRRD (*.nrrd). - Crop to MATLAB — exports each patch as a struct into the MATLAB workspace under an auto-generated variable name.
The struct contains
img(pixel data),pixSize(voxel size), and optionallyModelandMasksubfields.
Patch dimensions
- Width, px — total patch width in pixels (centred on the annotation X coordinate).
- Height, px — total patch height in pixels (centred on the annotation Y coordinate).
- Crop 3D objects checkbox — when checked, crops a 3D slab; the Depth field sets the number of slices centred on the annotation Z coordinate.
Filename options (file output only)
A dialog asks which components to append to the base filename:
- annotation name
- Z, X, or Y coordinate
- slice name as the filename template (uses per-slice names from the dataset when available)
Include model / mask
- Crop Model — include a cropped copy of the model layer alongside each image patch; choose the save format from the adjacent dropdown.
- Crop Mask — include a cropped copy of the mask layer; choose its format separately.
Jitter
Adds a random XY offset to each patch centre, useful for data augmentation:
- Variation — maximum pixel offset in each direction (offset drawn from
±Variation). - Seed — random seed for reproducibility;
0uses a new random seed each run.
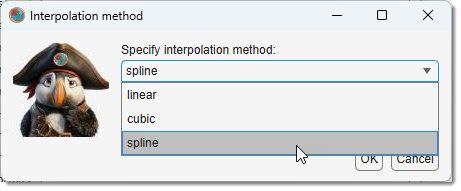 Interpolate between selected annotations: interpolate annotations across slices (linear for two, linear/cubic/spline for more).
-
Export selected annotations:
- export to MATLAB
- Amira landmarks (coordinates only)
- PSI format
- Excel
-
Export selected annotations to Imaris: export to Imaris (export dataset first) .
- Order: move annotations up/down the list.
- Delete selected annotation(s): delete selected annotations.
Tools panel
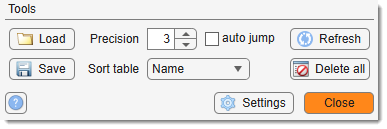
- import annotations from MATLAB or a file.
- export to MATLAB, CSV, Excel, Amira landmarks (coordinates only), or PSI format. Demo
- adjust value field precision.
- center the selected annotation in the Image View panel.
- sort by Name, Value, X, Y, Z, T.
- :
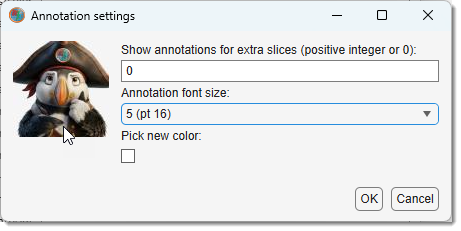
- Show annotations for extra slices: set depth range (0 = current slice only).
- Annotation size: set marker size (8–20pt).
- Annotation color: select color.
- update the list.
- remove all annotations.
Back to MIB | User interface | Panels | Segmentation