Adjust Display Window
Overview
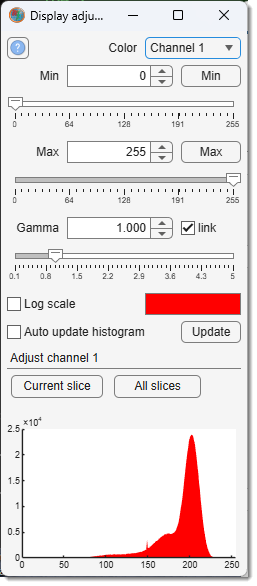
The Adjust Display window lets you fine-tune the contrast of your dataset for each color channel individually.
Warning
A histogram at the bottom shows intensity values for the currently displayed slice, helping you visualize adjustments.
List of widgets
- : choose the color channel to adjust.
-
Min slider and edit box (define the black point)
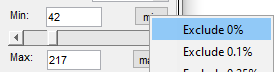
Sets the black point; intensities below this are rendered black.on the histogram sets this value; a click on the empty area to the left of the histogram moves the black point below the displayed range. on the slider sets it to 1. - Enter values (including negative) directly in the edit box.
-
: assigns the channel's minimal intensity as black.
on the button opens a menu to exclude a percentage of low-intensity points.
-
Max slider and edit box (define the white point)
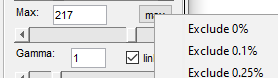
Sets the white point; intensities above this are rendered white or pure color.on the histogram sets this value; a click on the empty area to the right of the histogram moves the white point above the displayed range. on the slider sets it to the maximum for the image class. - Enter values (including above max) in the edit box.
-
: assigns the channel's maximal intensity as white.
on the button opens a menu to define the white point from the histogram.
-
Gamma: adjusts gamma: <1 enhances high intensities, >1 enhances low intensities.
on the slider sets it to 1.
: links all channels so Min/Max/Gamma changes apply to all simultaneously.
: switches histogram between linear and logarithmic scales.
: enables automatic histogram updates after each slice change.
: updates the histogram for the current slice.
: recalculates intensities for the selected channel on the current slice using specified parameters.
: recalculates intensities for the selected channel across all slices using specified parameters.
Histogram
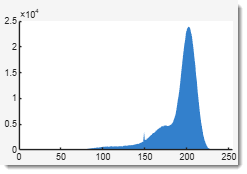
The histogram plots intensity values (X-axis) against pixel counts (Y-axis) for the image shown in the Image Document — not the full slice.
Warning
- Adjustments to Gamma are not reflected here
- Only the shown part of the image
Set Min and Max values for the histogram
- Manual entry in the edit boxes
- Slider adjustments
(to set the minimum intensity, i.e. the black point) click on the histogram (to set the maximum intensity, i.e. the white point) click on the histogram
Extend the displayed range
The histogram is drawn over the current Min-Max range, so a click inside it can only narrow the range. To extend it, click on the empty area beside the plot, i.e. on the margins where the axes tick labels are:
to the left of the histogram lowers the black point to the right of the histogram raises the white point
Each such click shifts the point by at least 10% of the currently displayed range, so the range can be extended step by step with repeated clicks.
Back to MIB | User interface | Panels | View Settings