 |
Microscopy Image Browser 2.91
MIB
|
|
Microscopy Image Browser 2.91
MIB
|
class is responsible for keeping Measurements More...

Public Member Functions | |
| mibMeasure (hImg) | |
| Constructor for the class. | |
| function | addMeasurements (newData, n) |
| add or insert measurement into the obj.Data structure | |
| function | addMeasurementsToPlot (mibModel, mode, axes) |
| plot measurement marks above images | |
| function | clearContents () |
| Set all elements of the class to default values. | |
| function | clearData () |
| Removes all values of the Data structure. | |
| function | generateKymograph (mibController, index, colCh, options) |
| generate kymograph and save it as an image | |
| function | editMeasurements (mibController, index, colCh, widthProfile, finetuneCheck, calcIntensity) |
| update measurements | |
| function | removeMeasurements (index) |
| removeMeasurements(obj, index) Remove measurement(s) from the class | |
| function | setOptions () |
| Update all values of the Options structure of the class. | |
| function | setDefaultOptions () |
| Set all values of the Options structure of the class to default values. | |
| function position = | drawROI (mibController, type, pos, instant) |
| show a ROI object in the mibController.mibView.handles.mibImageAxes for selection of the area to measure | |
| function | updateROIposition1 (new_position) |
| Update ROI position during movement of imrect and imellipse. | |
| function | updateROIposition2 (new_position) |
| Update position during movement of impoly, imline. | |
| function | updateROIScreenPosition (mode) |
| Updates position of ROI when plotting in handles.imageAxes. | |
| function number = | getNumberOfMeasurements () |
| number = getNumberOfMeasurements(obj) Get number of stored measurements | |
| function circ = | circlefit (x, y) |
| least squares circle fitting (see matlab help/demo (pendulum)) | |
| function result = | AngleFun (mibController, index, colCh, finetuneCheck, calcIntensity) |
| This function allows the measurement of an angle between 3 points. | |
| function result = | CaliperFun (mibController, index, colCh, finetuneCheck, calcIntensity) |
| measuring a distance between two opposite sides of an object | |
| function result = | CircleFun (mibController, index, colCh, finetuneCheck, calcIntensity) |
| This function allows the measurement of a radius. | |
| function result = | DistanceFreeFun (mibController, colCh, finetuneCheck, calcIntensity, freehandOptions) |
| measuring of distance along the free-hand path. The path is converted to the impoly line | |
| function result = | DistancePolyFun (mibController, index, colCh, noPoints, finetuneCheck, calcIntensity, options) |
| measuring of distance along the path | |
| function result = | PointFun (mibController, index, colCh, finetuneCheck, calcIntensity) |
| add a point as a marker | |
| function result = | DistanceFun (mibController, index, colCh, finetuneCheck, integrateWidth, calcIntensity, options) |
| measuring distance between two points | |
Public Attributes | |
| Data | |
a structure with measurements .Data.n - index, double .Data.type - type, string: LinDistance, .Data.value - value, double .Data.info - info, free text .Data.X - X-coordinates of points .Data.Y - Y-coordinates of points .Data.Z - Z-coordinates of points .Data.T - T-coordinates of points .Data.orientation - orientation of the measurement: 4-yx; 1-zx; 2-zy .Data.spline .Data.circ .Data.intensity - average intensity of the profile .Data.profile - intensity profile .Data.integrateWidth - only for Distance (linear) width of the integrated intensity profile, otherwise empty | |
| hImg | |
| handle to mibImage class | |
| Options | |
a structure with show options .Options.marker1 = o; - style 1 for markers .Options.marker2 = .; - style 2 for markers .Options.markersize = 10; - size of markers .Options.linestyle1 = -; - style 1 for lines .Options.linestyle2 = –; - style 2 for lines .Options.linewidth = 1 ; - width for lines .Options.color1 = y; - color style 1 .Options.color2 = k; - color style 2 .Options.textcolorfg = y; - text color .Options.textcolorbg = none; - color for text background .Options.fontsize = 14; - size of the font .Options.splinemethod = spline; - method for splines .Options.showMarkers = 1; .Options.showLines = 1; .Options.showText = 1; | |
| roi | |
| a structure with ROI data: | |
| typeToShow | |
| a string that defines type of measurements to show: | |
| fixZ | |
| a switch that fixes Z and T values when the measurements are recalculated | |
| EVENT | addMeasurement |
add a new measurement, when the Measure Tool is displayed note: use this syntax instead to send event motifyEvent.Name = addMeasurement; eventdata = ToggleEventData(motifyEvent); notify(obj.mibModel, modelNotify, eventdata); | |
| EVENT | updatePosition |
| update coordinates of measurements | |
class is responsible for keeping Measurements
| mibMeasure.mibMeasure | ( | hImg | ) |
Constructor for the class.
Constructor for the mibMeasure class. Create a new instance of the class with default parameters
| hImg | - handle to mibImage class |
References hImg.
| function mibMeasure.addMeasurements | ( | newData, | |
| n ) |
add or insert measurement into the obj.Data structure
| newData | structure of a new measurement to insert. Fields should match those of obj.Data |
| n | [optional] position where to add the measurement, default - number of measurements in obj.Data + 1 |
Examples:
References n.
| function mibMeasure.addMeasurementsToPlot | ( | mibModel, | |
| mode, | |||
| axes ) |
plot measurement marks above images
| mibModel | mibModel class of MIB |
| mode | a string that defines a mode of the shown image: shown (in most cases), or full (for panning) |
| axes | define a handles to axes that should be used for drawing, used in mibSnapshotGUI.m; default mibView.handles.mibImageAxes |
Examples:
References mibModel.convertDataToMouseCoordinates(), and mibModel.mibShowAnnotationsCheck.
| function result = mibMeasure.AngleFun | ( | mibController, | |
| index, | |||
| colCh, | |||
| finetuneCheck, | |||
| calcIntensity ) |
This function allows the measurement of an angle between 3 points.
| mibController | handle of mibController |
| index | [Optional] an index of measurement to update; when empty ([] ) - adds a new measurement |
| colCh | [optional] color channel to use for profile; default = 1 |
| finetuneCheck | [optional] 1 (default) - allow fine-tuning during the placing of measurements; 0 - instant placing |
| calcIntensity | [optional] 1 (default) - calculate intensity profile, 0 - do not calculate |
| calcIntensity | result - 1-success, 0-cancel |
Examples
References max, mibController.mibModel, mibController.mibView, n, and mibController.plotImage().
| function result = mibMeasure.CaliperFun | ( | mibController, | |
| index, | |||
| colCh, | |||
| finetuneCheck, | |||
| calcIntensity ) |
measuring a distance between two opposite sides of an object
| mibController | handle of mibController |
| index | [Optional] an index of measurement to update; when empty ([] ) - adds a new measurement |
| colCh | [optional] color channel to use for profile; default = 1 |
| finetuneCheck | [optional] 1 (default) - allow fine-tuning during the placing of measurements; 0 - instant placing |
| calcIntensity | [optional] 1 (default) - calculate intensity profile, 0 - do not calculate |
| calcIntensity | result - 1-success, 0-cancel |
Examples
References D(), max, mibController.mibModel, mibController.mibView, n, and mibController.plotImage().
| function circ = mibMeasure.circlefit | ( | x, | |
| y ) |
| function result = mibMeasure.CircleFun | ( | mibController, | |
| index, | |||
| colCh, | |||
| finetuneCheck, | |||
| calcIntensity ) |
This function allows the measurement of a radius.
| mibController | handle of mibController |
| index | [Optional] an index of measurement to update; when empty ([] ) - adds a new measurement |
| colCh | [optional] color channel to use for profile; default = 1 |
| finetuneCheck | [optional] 1 (default) - allow fine-tuning during the placing of measurements; 0 - instant placing |
| calcIntensity | [optional] 1 (default) - calculate intensity profile, 0 - do not calculate |
| calcIntensity | result - 1-success, 0-cancel |
Examples
References A(), B(), mibController.mibModel, mibController.mibView, n, and mibController.plotImage().
| function mibMeasure.clearContents | ( | ) |
Set all elements of the class to default values.
Examples:
| function mibMeasure.clearData | ( | ) |
Removes all values of the Data structure.
Examples:
| function result = mibMeasure.DistanceFreeFun | ( | mibController, | |
| colCh, | |||
| finetuneCheck, | |||
| calcIntensity, | |||
| freehandOptions ) |
measuring of distance along the free-hand path. The path is converted to the impoly line
| mibController | handle of mibController |
| colCh | [optional] color channel to use for profile; default = 1 |
| finetuneCheck | [optional] 1 (default) - allow fine-tuning during the placing of measurements; 0 - instant placing |
| calcIntensity | [optional] 1 (default) - calculate intensity profile, 0 - do not calculate |
| freehandOptions | structure with additional parameters .fixNumberPoints - logical, when checked do not ask for number of points .noPointsEdit - string with selected number of points to use |
| freehandOptions | result - 1-success, 0-cancel |
Examples
References mibInputMultiDlg(), mibController.mibModel, n, and mibController.plotImage().
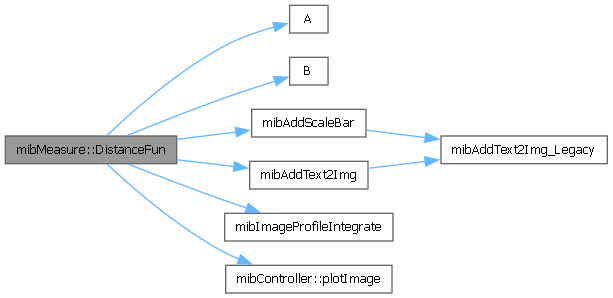
| function result = mibMeasure.DistanceFun | ( | mibController, | |
| index, | |||
| colCh, | |||
| finetuneCheck, | |||
| integrateWidth, | |||
| calcIntensity, | |||
| options ) |
measuring distance between two points
| mibController | handle of mibController |
| index | [Optional] an index of measurement to update; when empty ([] ) - adds a new measurement |
| colCh | [optional] color channel to use for profile; default = 1 |
| finetuneCheck | [optional] 1 (default) - allow fine-tuning during the placing of measurements; 0 - instant placing |
| integrateWidth | [optional] a number of pixels for integration of image intensity profile |
| calcIntensity | [optional] 1 (default) - calculate intensity profile, 0 - do not calculate |
| options | structure with additional options .widthProfile - width of profile for measurements of intensity profiles, could be empty .outputFilename - full path to the output file .outputFormat - output format, tif, csv, mat, preview', when preview show it as a plot .calcKymograph - true/false, calculate kymograph .addScale - add scale to kymograph |
| options | result - 1-success, 0-cancel |
Examples
References A(), B(), max, mibAddScaleBar(), mibAddText2Img(), mibImageProfileIntegrate(), mibController.mibModel, mibController.mibView, n, and mibController.plotImage().
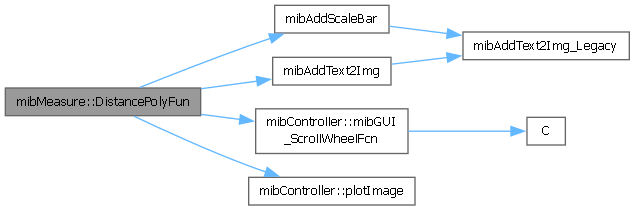
| function result = mibMeasure.DistancePolyFun | ( | mibController, | |
| index, | |||
| colCh, | |||
| noPoints, | |||
| finetuneCheck, | |||
| calcIntensity, | |||
| options ) |
measuring of distance along the path
| mibController | handle of mibController |
| index | [Optional] an index of measurement to update; when empty ([] ) - adds a new measurement |
| colCh | [optional] color channel to use for profile; default = 1 |
| noPoints | [optional] define number of points in the path; default = 5 |
| finetuneCheck | [optional] 1 (default) - allow fine-tuning during the placing of measurements; 0 - instant placing |
| calcIntensity | [optional] 1 (default) - calculate intensity profile, 0 - do not calculate |
| options | structure with additional options .widthProfile - width of profile for measurements of intensity profiles, could be empty .outputFilename - full path to the output file .outputFormat - output format, tif, csv, mat, preview', when preview show it as a plot .calcKymograph - true/false, calculate kymograph .addScale - add scale to kymograph |
| options | result - 1-success, 0-cancel |
Examples
References max, mibAddScaleBar(), mibAddText2Img(), mibController.mibGUI_ScrollWheelFcn(), mibController.mibModel, mibController.mibView, N, n, and mibController.plotImage().
| function position = mibMeasure.drawROI | ( | mibController, | |
| type, | |||
| pos, | |||
| instant ) |
show a ROI object in the mibController.mibView.handles.mibImageAxes for selection of the area to measure
Creates an instanse of Matlab imroi class and store it in mibMeasure.roi.imroi
| mibController | a handle of mibController class |
| type | a type of ROI: 'imline', 'imellipse' |
| pos | coordinates of the ROI
|
| instant | [optional], used only for imellipse to automatically get position of vertices. 1 or 0 (default). |
| position | coordinates of the selected area |
Examples:
References mibController.mibModel, and mibController.mibView.
| function mibMeasure.editMeasurements | ( | mibController, | |
| index, | |||
| colCh, | |||
| widthProfile, | |||
| finetuneCheck, | |||
| calcIntensity ) |
update measurements
| mibController | handle to mibController class |
| index | an index of the measurement to update |
| colCh | number of a color channel for intensity profile, or 0 for all color channels |
| widthProfile | [optional] width of profile for measurements of intensity profiles, could be empty |
| finetuneCheck | [optional] a number 0 - do not fine tune the measurement; 1-do the finetuning manually |
| calcIntensity | [optional] 1 (default) - calculate intensity profile, 0 - do not calculate |
References mibController.mibModel.
| function mibMeasure.generateKymograph | ( | mibController, | |
| index, | |||
| colCh, | |||
| options ) |
generate kymograph and save it as an image
| mibController | handle to mibController class |
| index | an index of the measurement to update |
| colCh | number of a color channel for intensity profile, or 0 for all color channels |
| options | structure with additional options .widthProfile - width of profile for measurements of intensity profiles, could be empty .outputFilename - full path to the output file .outputFormat - output format, tif, csv, mat .calcKymograph - true/false, calculate kymograph |
| function number = mibMeasure.getNumberOfMeasurements | ( | ) |
number = getNumberOfMeasurements(obj) Get number of stored measurements
| number | number of stored measurements |
Examples
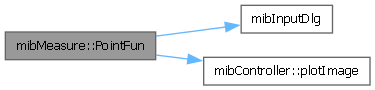
| function result = mibMeasure.PointFun | ( | mibController, | |
| index, | |||
| colCh, | |||
| finetuneCheck, | |||
| calcIntensity ) |
add a point as a marker
| mibController | handle of mibController |
| index | [Optional] an index of measurement to update; when empty ([] ) - adds a new measurement |
| colCh | [optional] color channel to use for profile; default = 1 |
| finetuneCheck | [optional] 1 (default) - allow fine-tuning during the placing of measurements; 0 - instant placing |
| calcIntensity | [optional] 1 (default) - calculate intensity profile, 0 - do not calculate |
| calcIntensity | result - 1-success, 0-cancel |
Examples
References mibInputDlg(), mibController.mibModel, mibController.mibView, n, and mibController.plotImage().
| function mibMeasure.removeMeasurements | ( | index | ) |
removeMeasurements(obj, index) Remove measurement(s) from the class
| index | [optional], an index of the measurement point to remove, when empty or zero - removes all points |
Examples
| function mibMeasure.setDefaultOptions | ( | ) |
Set all values of the Options structure of the class to default values.
Examples:
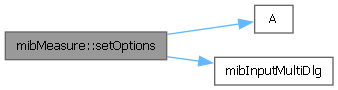
| function mibMeasure.setOptions | ( | ) |
Update all values of the Options structure of the class.
Examples:
References A(), and mibInputMultiDlg().
| function mibMeasure.updateROIposition1 | ( | new_position | ) |
Update ROI position during movement of imrect and imellipse.
one of two functions resposible for update of mibMeasure.roi. pos. The other one is mibMeasure.updateROIposition2()
| new_position | a vector with coordinates of a new position [xmin, ymin, width, height] |
References max.
| function mibMeasure.updateROIposition2 | ( | new_position | ) |
Update position during movement of impoly, imline.
one of two functions resposible for update of mibMeasure.roi. pos. The other one is mibMeasure.updateROIposition1()
| new_position | a vector with coordinates of a new position [point_number][x, y] |
References max.
| function mibMeasure.updateROIScreenPosition | ( | mode | ) |
Updates position of ROI when plotting in handles.imageAxes.
| mode | identifier of the updating mode:
|
Examples
References max.
| EVENT mibMeasure.addMeasurement |
add a new measurement, when the Measure Tool is displayed note: use this syntax instead to send event motifyEvent.Name = addMeasurement; eventdata = ToggleEventData(motifyEvent); notify(obj.mibModel, modelNotify, eventdata);
| mibMeasure.Data |
a structure with measurements .Data.n - index, double .Data.type - type, string: LinDistance, .Data.value - value, double .Data.info - info, free text .Data.X - X-coordinates of points .Data.Y - Y-coordinates of points .Data.Z - Z-coordinates of points .Data.T - T-coordinates of points .Data.orientation - orientation of the measurement: 4-yx; 1-zx; 2-zy .Data.spline .Data.circ .Data.intensity - average intensity of the profile .Data.profile - intensity profile .Data.integrateWidth - only for Distance (linear) width of the integrated intensity profile, otherwise empty
| mibMeasure.fixZ |
a switch that fixes Z and T values when the measurements are recalculated
| mibMeasure.hImg |
handle to mibImage class
Referenced by mibMeasure().
| mibMeasure.Options |
a structure with show options .Options.marker1 = o; - style 1 for markers .Options.marker2 = .; - style 2 for markers .Options.markersize = 10; - size of markers .Options.linestyle1 = -; - style 1 for lines .Options.linestyle2 = –; - style 2 for lines .Options.linewidth = 1 ; - width for lines .Options.color1 = y; - color style 1 .Options.color2 = k; - color style 2 .Options.textcolorfg = y; - text color .Options.textcolorbg = none; - color for text background .Options.fontsize = 14; - size of the font .Options.splinemethod = spline; - method for splines .Options.showMarkers = 1; .Options.showLines = 1; .Options.showText = 1;
| mibMeasure.roi |
a structure with ROI data:
imlineaddNewPositionCallback function | mibMeasure.typeToShow |
a string that defines type of measurements to show:
All - show allAngleCaliperCircle (R)Distance (linear)Distance (polyline)Point | EVENT mibMeasure.updatePosition |
update coordinates of measurements