 |
Microscopy Image Browser 2.91
MIB
|
|
Microscopy Image Browser 2.91
MIB
|
class is responsible for keeping 3d lines and skeletons More...

Public Member Functions | |
| Lines3D (Gin, activeNodeId, options) | |
| Constructor for the class. | |
| function | clearContents () |
| Set all elements of the class to default values. | |
| function | replaceGraph (Graph) |
| replace the current graph object with a new graph | |
| function Graph = | calculateLengthOfNodes (Graph, options) |
| calculate length of nodes | |
| function options = | getOptions () |
| get options of the class | |
| function | setOptions (options) |
| update options of the class | |
| function [ Graph , nodeIds , EdgesTable , NodesTable ] = | getTree (treeId) |
| [Graph, nodeIds, EdgesTable, NodesTable] = function getTree(obj, treeId) return graph with the tree specified in treeId | |
| function treeNames = | getTreeNames (index) |
| return name of trees | |
| function [ noTrees , nodeByTree ] = | updateNumberOfTrees () |
| update number of trees in the graph and get array of nodes by tree index | |
| function | deleteTree (treeId) |
| delete tree from the graph | |
| function | insertNode (nodeId, x, y, z) |
| insert node to a tree after nodeId, the inserted node becomes an active node | |
| function | updateNodeCoordinate (nodeId, x, y, z) |
| update coordinate of the node | |
| function | addNode (x, y, z, newTreeSwitch, options) |
| add a new node(s) to the graph; when x,y,z are columns of coordinates they are considered to be connected with edges | |
| function | connectNodes (s, t) |
| make an edge between two nodes | |
| function nodeId = | findClosestNode (x, y, z, orientation) |
| find the closest node to a point with coordinates x, y, z | |
| function | setActiveNode (x, y, z, orientation) |
| set active the node which is closest to a point with coordinates x, y, z as the active node | |
| function | splitAtNode (x, y, z, orientation) |
| split tree at the node that is closest to the point with coordinates x, y, z the node and its edges will be removed | |
| function result = | deleteNode (x, y, z, orientation) |
| delete node that is closest to the point with coordinates x, y, z the previous and following nodes get connected after remove of the node | |
| function | makeDummyGraph () |
| generate a dummy graph for developmental purposes | |
| function | updateNodeStrel (nodeStrelSize) |
| update strel element for showing nodes as circles | |
| function [ edge , edgeIds ] = | clipEdge (Box) |
| clip the edge using the Box matrix | |
| function [ nodes , indices ] = | findSliceNodes (z, orientation) |
| find nodes that are shown on the current slice | |
| function img = | addLinesToImage (img, Box, options) |
| add lines to the image | |
| function | saveToFile (filename, options) |
| save Lines3D to a file | |
Public Attributes | |
| G | |
a graph with lines .Edges - a table containing information about edges of the graph .EndNodes - connectivity table [edgeId][Node1 Node2], each row defines an edge with indices of nodes that form the edge .Edges - matrix with coordinates of the edges, [edgeId][x1 y1 z1 x2 y2 z2], IN PHYSICAL UNITS .Weight - weights of edges .Length - length of nodes, IN PHYSICAL UNITS .Nodes - a table containing information about nodes of the graph .PointsXYZ - coordinates of nodes [NodeId][x, y, z] IN PHYSICAL UNITS to recalculate from pixels to the imaging units use mibImage.convertPixelsToUnits: .TreeName - a cell array where each nodes has name of tree to which the node belong, [NodeId]{TreeName} .NodeName - a cell array with names for the nodes, [NodeId]{NodeName} .Radius - a vector with radii of nodes .Properties.VariableUnits - a cell array with units for each variable, when coordinate are pixels, MIB suggest recompute them to image units .Properties.UserData.pixSize - a structure with pixSize of the underlying dataset .x - x resoulution, um/px .y - x resoulution, um/px .z - x resoulution, um/px .Properties.UserData.BoundingBox - a vector with the bounding box information [xmin, width, ymin, height, zmin, depth] | |
| activeNodeId = "[]" | |
| clipExtraThickness = 1 | |
| index of the active node | |
| defaultNodeName = "Node" | |
| a number, extend clipping of the edges with additional thickness +/- this number sections default name for nodes | |
| defaultTreeName = "Tree" | |
| default name for trees | |
| edgeActiveColor = "[0.984, 0.549, 0.000]" | |
| edgeColor = "[1.000, 0.800, 0.502]" | |
| color of edges for the active tree [R, G, B], from 0 to 1 | |
| edgeThickness = 2 | |
| color of edges [R, G, B], from 0 to 1 | |
| extraEdgeFields = "[]" | |
| thickness of edges | |
| extraEdgeFieldsNumeric = "[]" | |
| a cell array with names of additional fields in the Edges table of the graph object | |
| extraNodeFields = "[]" | |
| a vector with indicator whether the field in extraEdgeFields is numeric (1) or not (0) | |
| extraNodeFieldsNumeric = "[]" | |
| a cell array with names of additional fields in the Nodes table of the graph object | |
| filename = "[]" | |
| a vector with indicator whether the field in extraNodeFields is numeric (1) or not (0) | |
| nodeActiveColor = "[1.0000 0.0000 0]" | |
| filename of the Lines3D file | |
| nodeColor = "[1.0000 1.0000 0]" | |
| color of the active node [R, G, B], from 0 to 1 | |
| nodeRadius = 5 | |
| color of nodes [R, G, B], from 0 to 1 | |
| nodeStrel | |
| radius of nodes | |
| noTrees = 0 | |
| strel element for making nodes | |
| treeLengths | |
| number of trees of the graph total length of each tree, numeric array | |
class is responsible for keeping 3d lines and skeletons
| Lines3D.Lines3D | ( | Gin, | |
| activeNodeId, | |||
| options ) |
Constructor for the class.
Constructor for the Lines3D class. Create a new instance of the class with default parameters
| Gin | [optional] graph with 3d lines .Edges - a table containing information about edges of the graph .EndNodes - connectivity table [edgeId][Node1 Node2], each row defines an edge with indices of nodes that form the edge .Edges - matrix with coordinates of the edges, [edgeId][x1 y1 z1 x2 y2 z2] .Nodes - a table containing information about nodes of the graph .PointsXYZ - coordinates of nodes [NodeId][x, y, z] to recalculate from pixels to the imaging units use mibImage.convertPixelsToUnits .Properties.UserData.pixSize - pixSize structure .Properties.UserData.BoundingBox - bounding box [xmin, width, ymin, height, zmin, depth] .Properties.VariableUnits - a cell array with units for each variable, when coordinate are pixels, MIB suggest recompute them to image units |
| activeNodeId | [optional] index of the active node, can be empty |
| options | [optional] a structure with additional settings .edgeColor - color of edges [R, G, B], from 0 to 1 .edgeThickness - thickness of edges .nodeColor - color of nodes [R, G, B], from 0 to 1 .nodeActiveColor - color of the active node [R, G, B], from 0 to 1 .nodeRadius - radius of nodes |
References activeNodeId.
| function img = Lines3D.addLinesToImage | ( | img, | |
| Box, | |||
| options ) |
add lines to the image
| img | image where lines should be added |
| Box | a vector with a clipping box [xmin xmax ymin ymax zmin zmax] |
| options | an optional structure with additional parameters .orientation - a number that specifies desired orientation, 4-yx, 1-xz, 2-yz |
| img | an image with fused lines |
| function Lines3D.addNode | ( | x, | |
| y, | |||
| z, | |||
| newTreeSwitch, | |||
| options ) |
add a new node(s) to the graph; when x,y,z are columns of coordinates they are considered to be connected with edges
| x | a column of x coordinates of nodes (in physical units) |
| y | a column of y coordinates of nodes (in physical units) |
| z | a column of z coordinates of nodes (in physical units) |
| newTreeSwitch | an optional switch to start a new tree |
| options | a structure with optional parameters .pixSize - structure with pixel sizes of the dataset .BoundingBox - a vector with the bounding box information [xmin, width, ymin, height, zmin, depth] |
| function Graph = Lines3D.calculateLengthOfNodes | ( | Graph, | |
| options ) |
calculate length of nodes
| Graph | a graph object |
| options | [optional] - an optional structure with additional parameters .nodeId - ids of nodes that include edges that should be recalculated |
| Graph | the graph object with added/modified Length field |
| function Lines3D.clearContents | ( | ) |
Set all elements of the class to default values.
Examples:
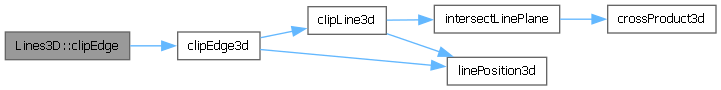
| function [ edge , edgeIds ] = Lines3D.clipEdge | ( | Box | ) |
clip the edge using the Box matrix
| Box | a vector used for cliping the edges [xMin, xMax, yMin, yMax, zMin, zMax] |
| edge | a matrix of edges shown inside the clipping box, [x1 y1 z1 x2 y2 z2] |
| edgeIds | indices of the returned edges |
References clipEdge3d().
| function Lines3D.connectNodes | ( | s, | |
| t ) |
make an edge between two nodes
| s | index of the first node |
| t | index of the second node |
References max.
| function result = Lines3D.deleteNode | ( | x, | |
| y, | |||
| z, | |||
| orientation ) |
delete node that is closest to the point with coordinates x, y, z the previous and following nodes get connected after remove of the node
removed tree - the last node of a tree was removed, so the tree middle node - the removed node was in a middle of a tree multiple split - the node had more than 2 connections and as result multiple new trees were formed| x | x coordinate of a point next to the node, or index of the node (in this case, y and z should be empty) |
| y | y coordinate of a point next to the node |
| z | z coordinate of a point next to the node |
| orientation | [optional] a number with orientation of the dataset, 4-yx, 1-xz, 2-yz, default 4 |
References N.
| function Lines3D.deleteTree | ( | treeId | ) |
delete tree from the graph
| treeId | index of the tree to delete, or string with name of the tree |
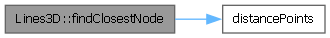
| function nodeId = Lines3D.findClosestNode | ( | x, | |
| y, | |||
| z, | |||
| orientation ) |
find the closest node to a point with coordinates x, y, z
| x | x coordinate of a point next to the node |
| y | y coordinate of a point next to the node |
| z | z coordinate of a point next to the node |
| orientation | [optional] a number with orientation of the dataset, 4-yx, 1-xz, 2-yz, default 4 |
References distancePoints(), and min.
| function [ nodes , indices ] = Lines3D.findSliceNodes | ( | z, | |
| orientation ) |
find nodes that are shown on the current slice
| z | Z-value to obtain the nodes |
| orientation | [optional, default 4 for XY] a number that specifies desired orientation, 4-yx, 1-xz, 2-yz |
| nodes | a matrix with coordinates of nodes [node; x, y, z] |
| indices | a vector with indices of returned nodes |
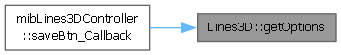
| function options = Lines3D.getOptions | ( | ) |
get options of the class
Referenced by mibLines3DController.saveBtn_Callback().
| function [ Graph , nodeIds , EdgesTable , NodesTable ] = Lines3D.getTree | ( | treeId | ) |
[Graph, nodeIds, EdgesTable, NodesTable] = function getTree(obj, treeId) return graph with the tree specified in treeId
| treeId | index of tree to get |
| Graph | graph object containing tree specified in treeId |
| nodeIds | indices of nodes belonging to this tree |
| EdgesTable | a table with edges that belong to treeId |
| NodesTable | a table with nodes that belong to treeId |
| function treeNames = Lines3D.getTreeNames | ( | index | ) |
return name of trees
| index | [optional] indices of the trees |
| treeNames | a cell array with names of trees |
| function Lines3D.insertNode | ( | nodeId, | |
| x, | |||
| y, | |||
| z ) |
insert node to a tree after nodeId, the inserted node becomes an active node
| nodeId | index of the node after which a new node should be inserted |
| x | new x coordinate |
| y | new y coordinate |
| z | new z coordinate |
| function Lines3D.makeDummyGraph | ( | ) |
generate a dummy graph for developmental purposes
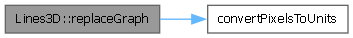
| function Lines3D.replaceGraph | ( | Graph | ) |
replace the current graph object with a new graph
.Edges - a table containing information about edges of the graph .EndNodes - connectivity table [edgeId][Node1 Node2], each row defines an edge with indices of nodes that form the edge .Edges - [optional] a matrix with coordinates of the edges, [edgeId][x1 y1 z1 x2 y2 z2], (in physical units) .Weight - [optional] a vector of weights for each edge .Length - [optional] a vector of length for each edge (in physical units)
| Graph | graph object with a new graph, required fields (may have more) .Nodes - a table containing information about nodes of the graph .PointsXYZ - matrix with coordinates of nodes [nodeId](x, y, z) (in physical units) to recalculate from pixels to the imaging units use mibImage.convertPixelsToUnits .TreeName - [optional] a cell array where each entry contains name of the node's parant tree .NodeName - [optional] a cell array where each entry has name of the corresponding node .Radius - [optional] a vector with radius parameter for each node .[name_of_field] - [optional] optional fields as either array of vectors or cells .Properties.UserData.pixSize - a structure with pixSize of the underlying dataset .x - x resoulution, um/px .y - x resoulution, um/px .z - x resoulution, um/px .Properties.UserData.BoundingBox - a vector with the bounding box information [xmin, width, ymin, height, zmin, depth] .Properties.VariableUnits - a cell array with units for each variable, when coordinate are pixels, MIB suggest recompute them to image units |
References convertPixelsToUnits(), and max.
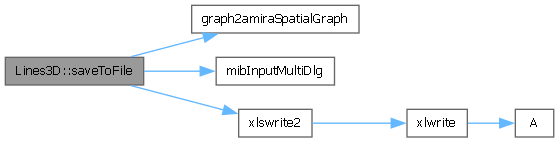
| function Lines3D.saveToFile | ( | filename, | |
| options ) |
save Lines3D to a file
| filename | full path to file |
| options | a structure with optional paramters .format - a char string lines3d - MIB lines3d format amira-ascii - amira ascii amira-binary - amira binary excel - Microsoft Excel format .treeId - a number with index of a tree to save, when empty save all graph .NodeFieldName - [optional] name of variable for nodes to save, only for Amira .EdgeFieldName - [optional] name of variable for edges to save, only for Amira .showWaitbar - [optional] a number 1-show; 0-do not show the waitbar |
References filename, graph2amiraSpatialGraph(), mibInputMultiDlg(), and xlswrite2().
| function Lines3D.setActiveNode | ( | x, | |
| y, | |||
| z, | |||
| orientation ) |
set active the node which is closest to a point with coordinates x, y, z as the active node
| x | x coordinate of a point next to the node |
| y | y coordinate of a point next to the node |
| z | z coordinate of a point next to the node |
| orientation | [optional] a number with orientation of the dataset, 4-yx, 1-xz, 2-yz, default 4 |
| function Lines3D.setOptions | ( | options | ) |
update options of the class
| function Lines3D.splitAtNode | ( | x, | |
| y, | |||
| z, | |||
| orientation ) |
split tree at the node that is closest to the point with coordinates x, y, z the node and its edges will be removed
| x | x coordinate of a point next to the node |
| y | y coordinate of a point next to the node |
| z | z coordinate of a point next to the node |
| orientation | [optional] a number with orientation of the dataset, 4-yx, 1-xz, 2-yz, default 4 |
| function Lines3D.updateNodeCoordinate | ( | nodeId, | |
| x, | |||
| y, | |||
| z ) |
update coordinate of the node
| nodeId | index of the node to update |
| x | new x coordinate |
| y | new y coordinate |
| z | new z coordinate |
| function Lines3D.updateNodeStrel | ( | nodeStrelSize | ) |
update strel element for showing nodes as circles
| function [ noTrees , nodeByTree ] = Lines3D.updateNumberOfTrees | ( | ) |
| Lines3D.activeNodeId = "[]" |
Referenced by Lines3D(), mibLines3DController.loadBtn_Callback(), and mibLines3DController.saveBtn_Callback().
| Lines3D.clipExtraThickness = 1 |
index of the active node
Default: 1
| Lines3D.defaultNodeName = "Node" |
a number, extend clipping of the edges with additional thickness +/- this number sections default name for nodes
Default: "Node"
| Lines3D.defaultTreeName = "Tree" |
default name for trees
Default: "Tree"
| Lines3D.edgeActiveColor = "[0.984, 0.549, 0.000]" |
| Lines3D.edgeColor = "[1.000, 0.800, 0.502]" |
color of edges for the active tree [R, G, B], from 0 to 1
Default: "[1.000, 0.800, 0.502]"
| Lines3D.edgeThickness = 2 |
color of edges [R, G, B], from 0 to 1
Default: 2
| Lines3D.extraEdgeFields = "[]" |
thickness of edges
Default: "[]"
| Lines3D.extraEdgeFieldsNumeric = "[]" |
a cell array with names of additional fields in the Edges table of the graph object
Default: "[]"
| Lines3D.extraNodeFields = "[]" |
a vector with indicator whether the field in extraEdgeFields is numeric (1) or not (0)
Default: "[]"
| Lines3D.extraNodeFieldsNumeric = "[]" |
a cell array with names of additional fields in the Nodes table of the graph object
Default: "[]"
| Lines3D.filename = "[]" |
a vector with indicator whether the field in extraNodeFields is numeric (1) or not (0)
Default: "[]"
Referenced by mibLines3DController.loadBtn_Callback(), and saveToFile().
| Lines3D.G |
a graph with lines .Edges - a table containing information about edges of the graph .EndNodes - connectivity table [edgeId][Node1 Node2], each row defines an edge with indices of nodes that form the edge .Edges - matrix with coordinates of the edges, [edgeId][x1 y1 z1 x2 y2 z2], IN PHYSICAL UNITS .Weight - weights of edges .Length - length of nodes, IN PHYSICAL UNITS .Nodes - a table containing information about nodes of the graph .PointsXYZ - coordinates of nodes [NodeId][x, y, z] IN PHYSICAL UNITS to recalculate from pixels to the imaging units use mibImage.convertPixelsToUnits: .TreeName - a cell array where each nodes has name of tree to which the node belong, [NodeId]{TreeName} .NodeName - a cell array with names for the nodes, [NodeId]{NodeName} .Radius - a vector with radii of nodes .Properties.VariableUnits - a cell array with units for each variable, when coordinate are pixels, MIB suggest recompute them to image units .Properties.UserData.pixSize - a structure with pixSize of the underlying dataset .x - x resoulution, um/px .y - x resoulution, um/px .z - x resoulution, um/px .Properties.UserData.BoundingBox - a vector with the bounding box information [xmin, width, ymin, height, zmin, depth]
Referenced by mibLines3DController.loadBtn_Callback(), and mibLines3DController.saveBtn_Callback().
| Lines3D.nodeActiveColor = "[1.0000 0.0000 0]" |
filename of the Lines3D file
Default: "[1.0000 0.0000 0]"
| Lines3D.nodeColor = "[1.0000 1.0000 0]" |
color of the active node [R, G, B], from 0 to 1
Default: "[1.0000 1.0000 0]"
| Lines3D.nodeRadius = 5 |
color of nodes [R, G, B], from 0 to 1
Default: 5
| Lines3D.nodeStrel |
radius of nodes
| Lines3D.noTrees = 0 |
| Lines3D.treeLengths |
number of trees of the graph total length of each tree, numeric array