 |
Microscopy Image Browser 2.91
MIB
|
|
Microscopy Image Browser 2.91
MIB
|
IMRICHRAG Region adjacency graph of a labeled image with edge infos, originating from the imRAG function. More...
Functions | |
| function varargout = | imRichRAG (img, varargin) |
| IMRICHRAG Region adjacency graph of a labeled image with edge infos, originating from the imRAG function. | |
IMRICHRAG Region adjacency graph of a labeled image with edge infos, originating from the imRAG function.
| function varargout = imRichRAG | ( | img, | |
| varargin ) |
IMRICHRAG Region adjacency graph of a labeled image with edge infos, originating from the imRAG function.
LBL1 is given in ascending order, LBL2 is given in ascending order for
[ADJ, BORDER_IDXS] = imRichRAG(IMG); Return two arrays: ADJ is the adjacency previously described; BORDER_IDXS a cell array of image indices that belong to the border that separates two adjacent regions, implemented for GAP==1
[ADJ, MEAN_INTENSITY] = imRichRAG(IMG, 1, IMG2); Return two arrays: ADJ is the adjacency previously described; MEAN_INTENSITY an array of mean intensity of IMG2 between each two adjacent superpixels, 1 - is gap between superpixels, IMG2 - the image to be used for MEAN_INTENSITY calculation
[ADJ, BORDER_IDXS, NODES] = imRichRAG(IMG); Return three arrays: ADJ is the adjacency; BORDER_IDXS - border indices; NODES [N*2] array containing centroids of the N labeled region, For 3D images, the nodes array is [N*3].
Example (requires image processing toolbox) % read and display an image with several objects img = imread(coins.png); figure(1); clf; imshow(img); hold on; % compute the Skeleton by influence zones using watershed bin = imfill(img>100, holes); dist = bwdist(bin); wat = watershed(dist, 4); % compute overlay image for display tmp = uint8(double(img).*(wat>0)); ovr = uint8(cat(3, max(img, uint8(255*(wat==0))), tmp, tmp)); imshow(ovr); % show the resulting graph [edgeList, edgeIndsList, nodeList] = imRichRAG(wat); % allocate memory for results, still using 2 columns nEdges = size(edgeList, 1); stats2 = zeros(nEdges, 2);
% for each edge, grablist of indices, compute length an average value % within grayscale image for iEdge = 1:nEdges inds = edgeIndsList{iEdge}; stats2(iEdge, 3) = length(inds); stats2(iEdge, 4) = mean(img(inds)); end
% display result using blank image as background figure; imshow(ones(size(img))); hold on; for iEdge = 1:size(edgeList, 1) edge = edgeList(iEdge,:); plot(nodeList(edge, 1), nodeList(edge, 2), linewidth, 1, color, b); pos = (nodeList(edge(1), :) + nodeList(edge(2), :)) / 2; text(pos(1)+2, pos(2)+2, sprintf(d, stats2(iEdge, 3))); end
% Create a basic 3D image with labels, and compute RAG germs = [50 50 50;... 20 20 20;80 20 20;20 80 20;80 80 20; ... 20 20 80;80 20 80;20 80 80;80 80 80]; img = zeros([100 100 100]); for i = 1:size(germs, 1) img(germs(i,1), germs(i,2), germs(i,3)) = 1; end wat = watershed(bwdist(img), 6); [edgeList, edgeIndsList, nodeList] = imRichRAG(wat); figure; drawGraph(nodeList, edgeList); view(3);
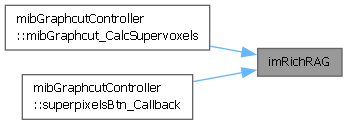
Referenced by mibGraphcutController.mibGraphcut_CalcSupervoxels(), and mibGraphcutController.superpixelsBtn_Callback().